Column-Level Lineage, Model Performance, and Recommendations: ship trusted data products with dbt Explorer
What’s in a data platform?
Raising a dbt project is hard work. We, as data professionals, have poured ourselves into raising happy healthy data products, and we should be proud of the insights they’ve driven. It certainly wasn’t without its challenges though — we remember the terrible twos, where we worked hard to just get the platform to walk straight. We remember the angsty teenage years where tests kept failing, seemingly just to spite us. A lot of blood, sweat, and tears are shed in the service of clean data!
Once the project could dress and feed itself, we also worked hard to get buy-in from our colleagues who put their trust in our little project. Without deep trust and understanding of what we built, our colleagues who depend on your data (or even those involved in developing it with you — it takes a village after all!) are more likely to be in your DMs with questions than in their BI tools, generating insights.
When our teammates ask about where the data in their reports come from, how fresh it is, or about the right calculation for a metric, what a joy! This means they want to put what we’ve built to good use — the challenge is that, historically, it hasn’t been all that easy to answer these questions well. That has often meant a manual, painstaking process of cross checking run logs and your dbt documentation site to get the stakeholder the information they need.
Enter dbt Explorer! dbt Explorer centralizes documentation, lineage, and execution metadata to reduce the work required to ship trusted data products faster.
dbt Explorer: an upgrade to data discovery
In the days of yore, answering a question about your data platform may have required a bit of cryptography, sifting through possibly-up-to-date documentation in your internal wiki, run logs to figure out when your models were executed, and slacking the data team member with the most tenure. In the past several years, dbt Docs helped centralize the documentation workflow and dramatically improved the documentation process. While useful, dbt Docs only ever provides a single point in time snapshot, and lacks any sense of your platform’s deployment and execution information. dbt Explorer supercharges the docs experience by providing stateful awareness of your data platform, making support and triage of your platform easier than ever — it even proactively lets you know what to focus on to build even higher quality data products!
Where’s this data coming from?
Your stakeholders and fellow developers both need a way to orient themselves within your dbt project, and a way to know the full provenance of the number staring at them in their spreadsheet. Where did this info come from? Does it include XYZ data source, or just ABC?
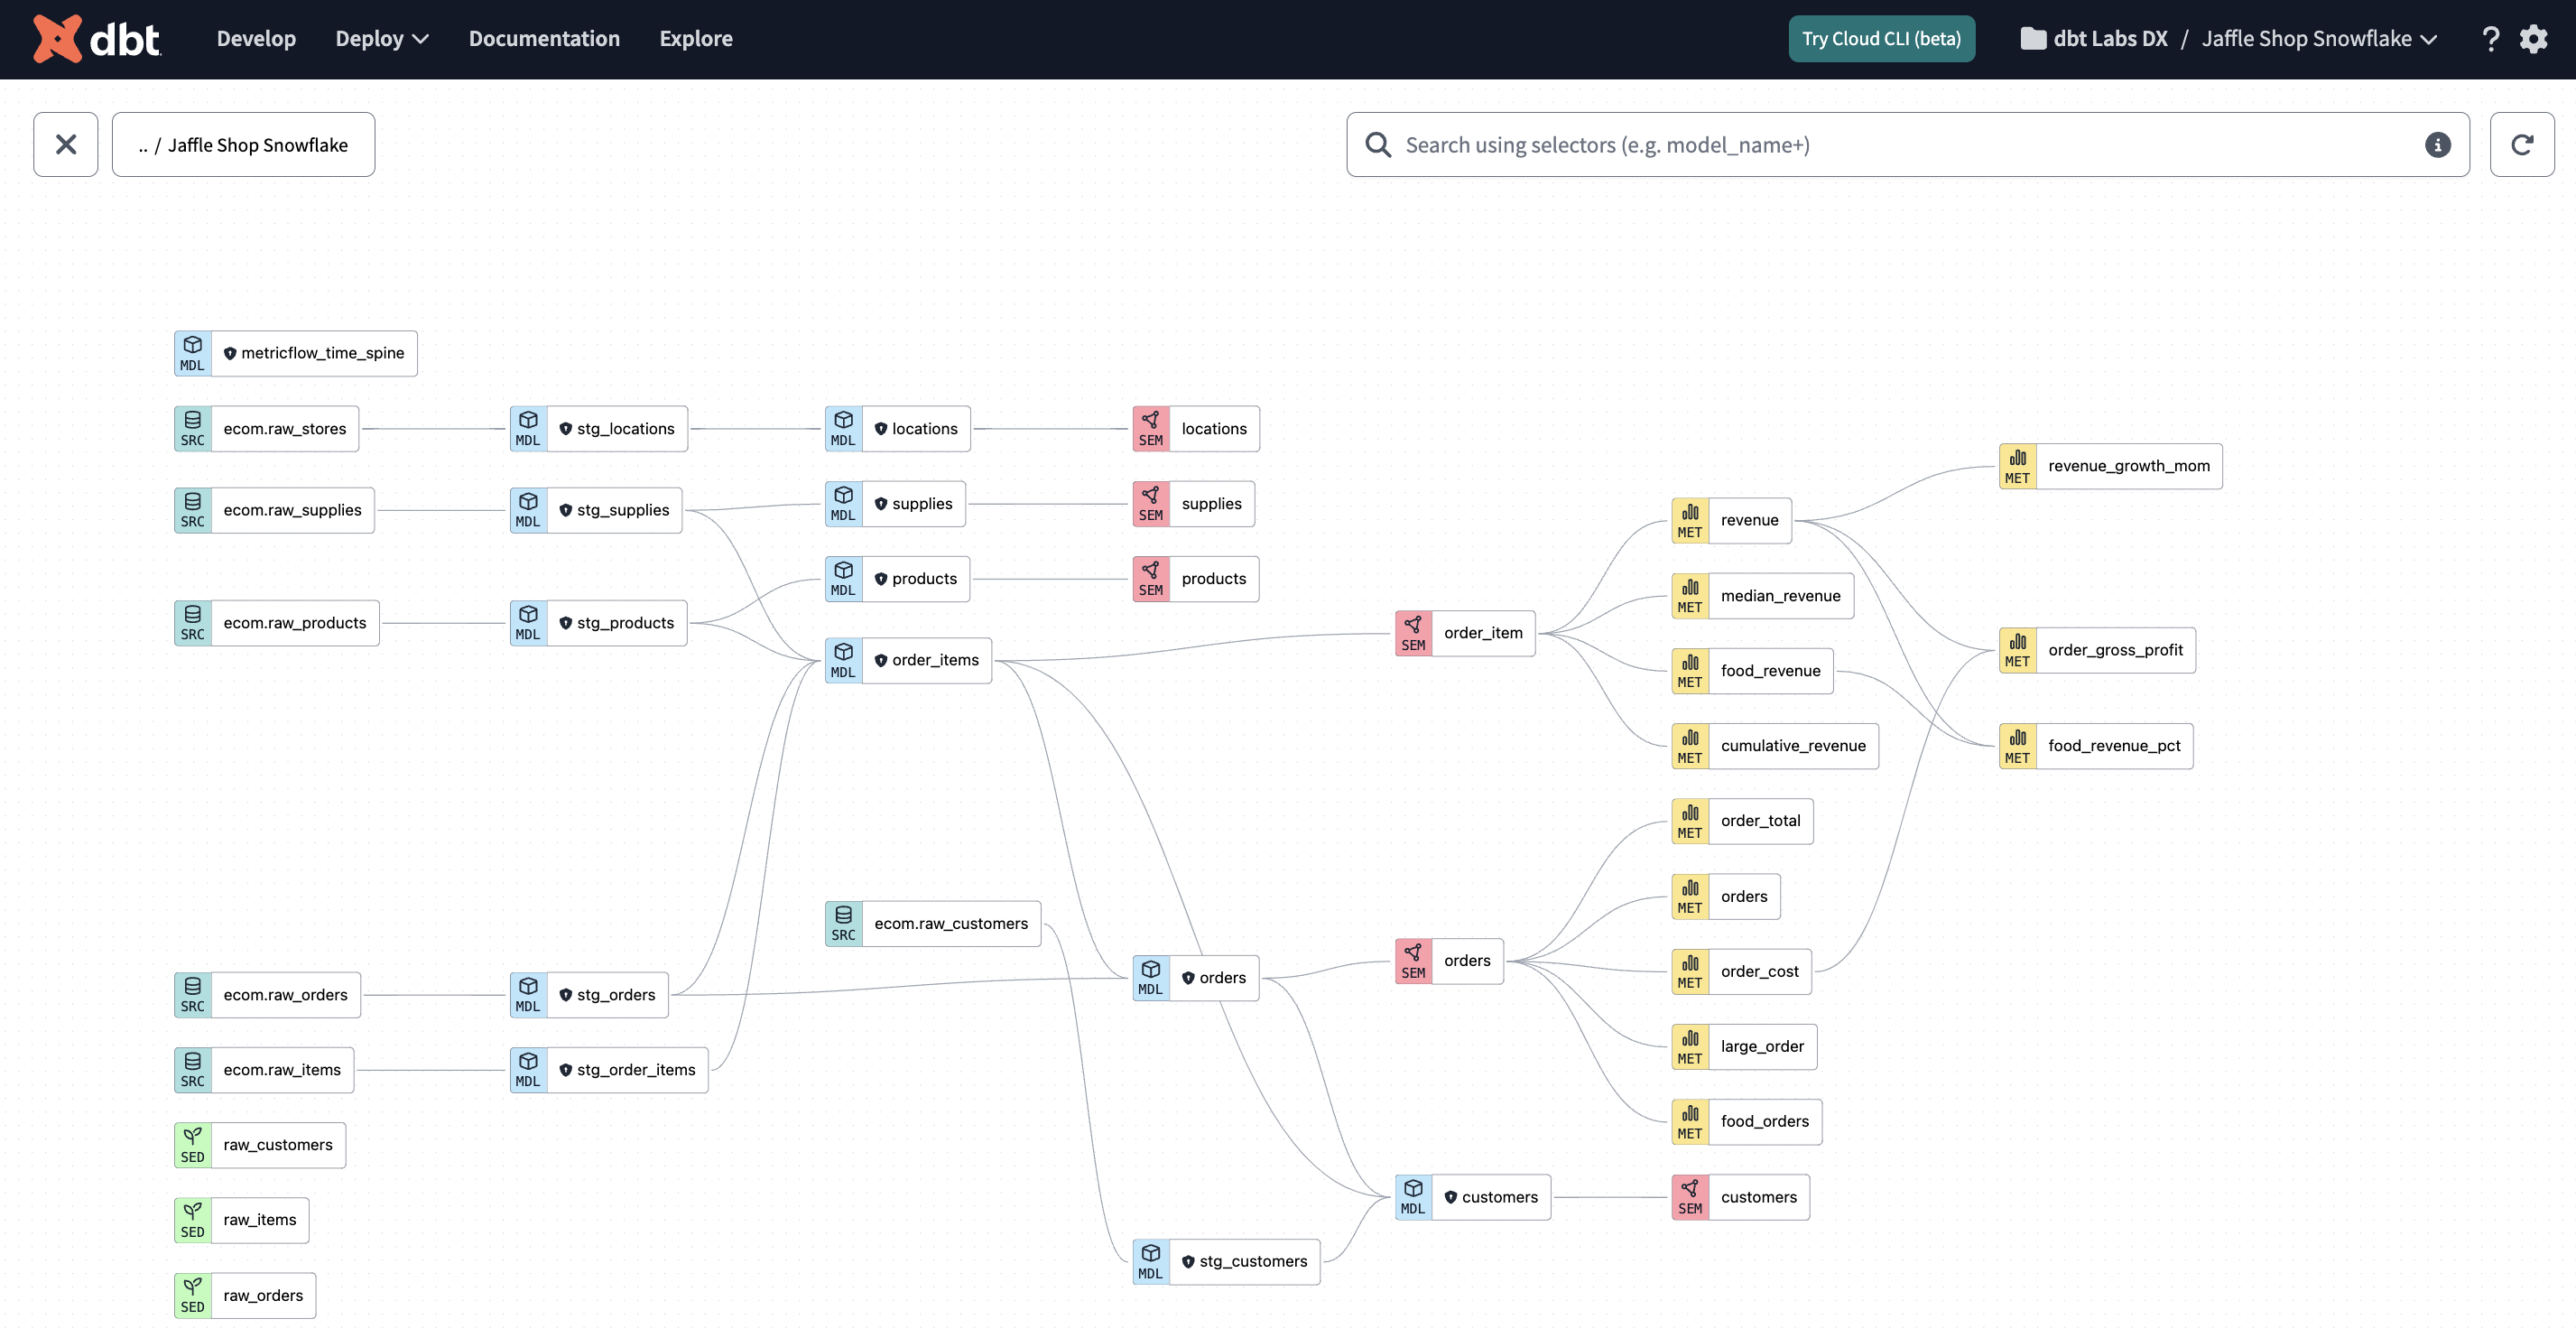
It’s the classic stakeholder question for a reason! Knowing data lineage inherently increases your level of trust in the reporting you use to make the right decisions. The dbt DAG has long served as the map of your data flows, tracing the flow from raw data to ready-to-query data mart.
dbt Explorer builds on this experience in three key ways:
- Lineage 🤝 Docs - dbt Explorer’s lineage is embedded into the documentation page for each resource, meaning there’s no need to toggle between your DAG and your docs, and lose valuable context. Similarly, when you’re navigating the DAG in full screen mode, clicking on a resource in your project loads a summary panel of the most critical info about the resource you’re interested in (including execution status, data contract info, you name it). Understanding the lineage via the DAG and the context from your written documentation is one workflow in Explorer, not two.
- Cross project lineage - if you’re using the new dbt Mesh architecture, you may trace your data back to the end of the DAG and find its source is not raw data, but in fact the output of another team’s dbt project! Luckily, dbt Explorer provides first class support for visualizing and understanding cross project lineage when using the dbt Mesh:
- Account View + Project DAG: dbt Explorer provides a higher level view of the relationships between all your projects in your dbt Cloud Account — you can trace the lineage across the projects, and easily drill down into each project. When you click on a project in this view, the side panel includes a list of all the public models available for use. Double clicking opens up the lineage for that specific project, making it easy to traverse across your organization’s knowledge graph!
- Cross Project Icons: When you’re in a project’s lineage, dbt Explorer marks cross-project relationships to make it clear when there are dependencies that span multiple projects. Stakeholders can quickly understand which project owners they may need to contact if they need more information about a dataset.
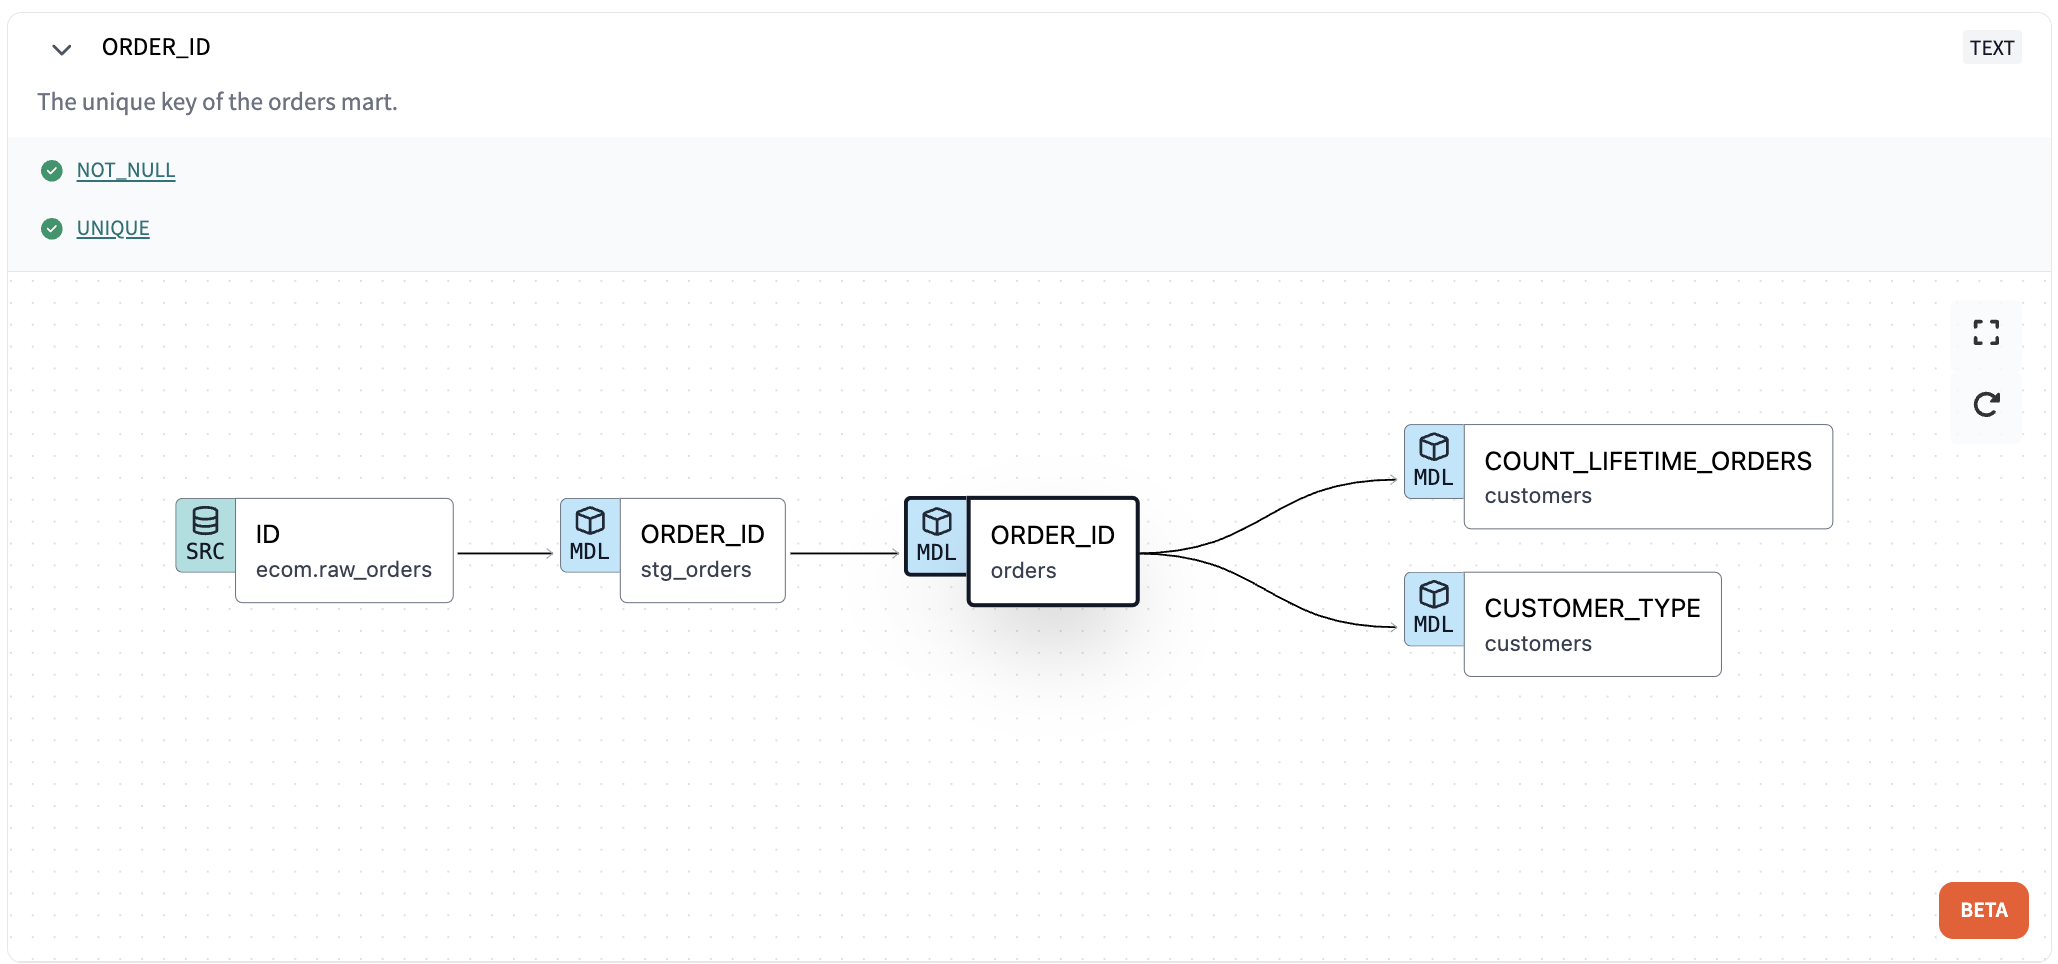
- Column level lineage - long time listeners of the pod know that column level lineage is a frequently requested feature within dbt. It’s one thing to know how data flows between models, but the column level relationships help you understand precisely how data is used in models — this makes debugging data issues a lot simpler! We’re stoked to announce that dbt Explorer offers this feature embedded alongside your model lineage as well.
With dbt Explorer, you can answer any question about your data’s lineage at any grain, whether its project to project, model to model, or column to column.
Ok but is it fresh? Is it right?
Once the data’s journey to your BI tool is clear, there’s a natural second question one would ask before using it — is it, uh, good data? Just knowing where it came from is not enough to build trust in the data product — you need to know if it’s timely and accurate.
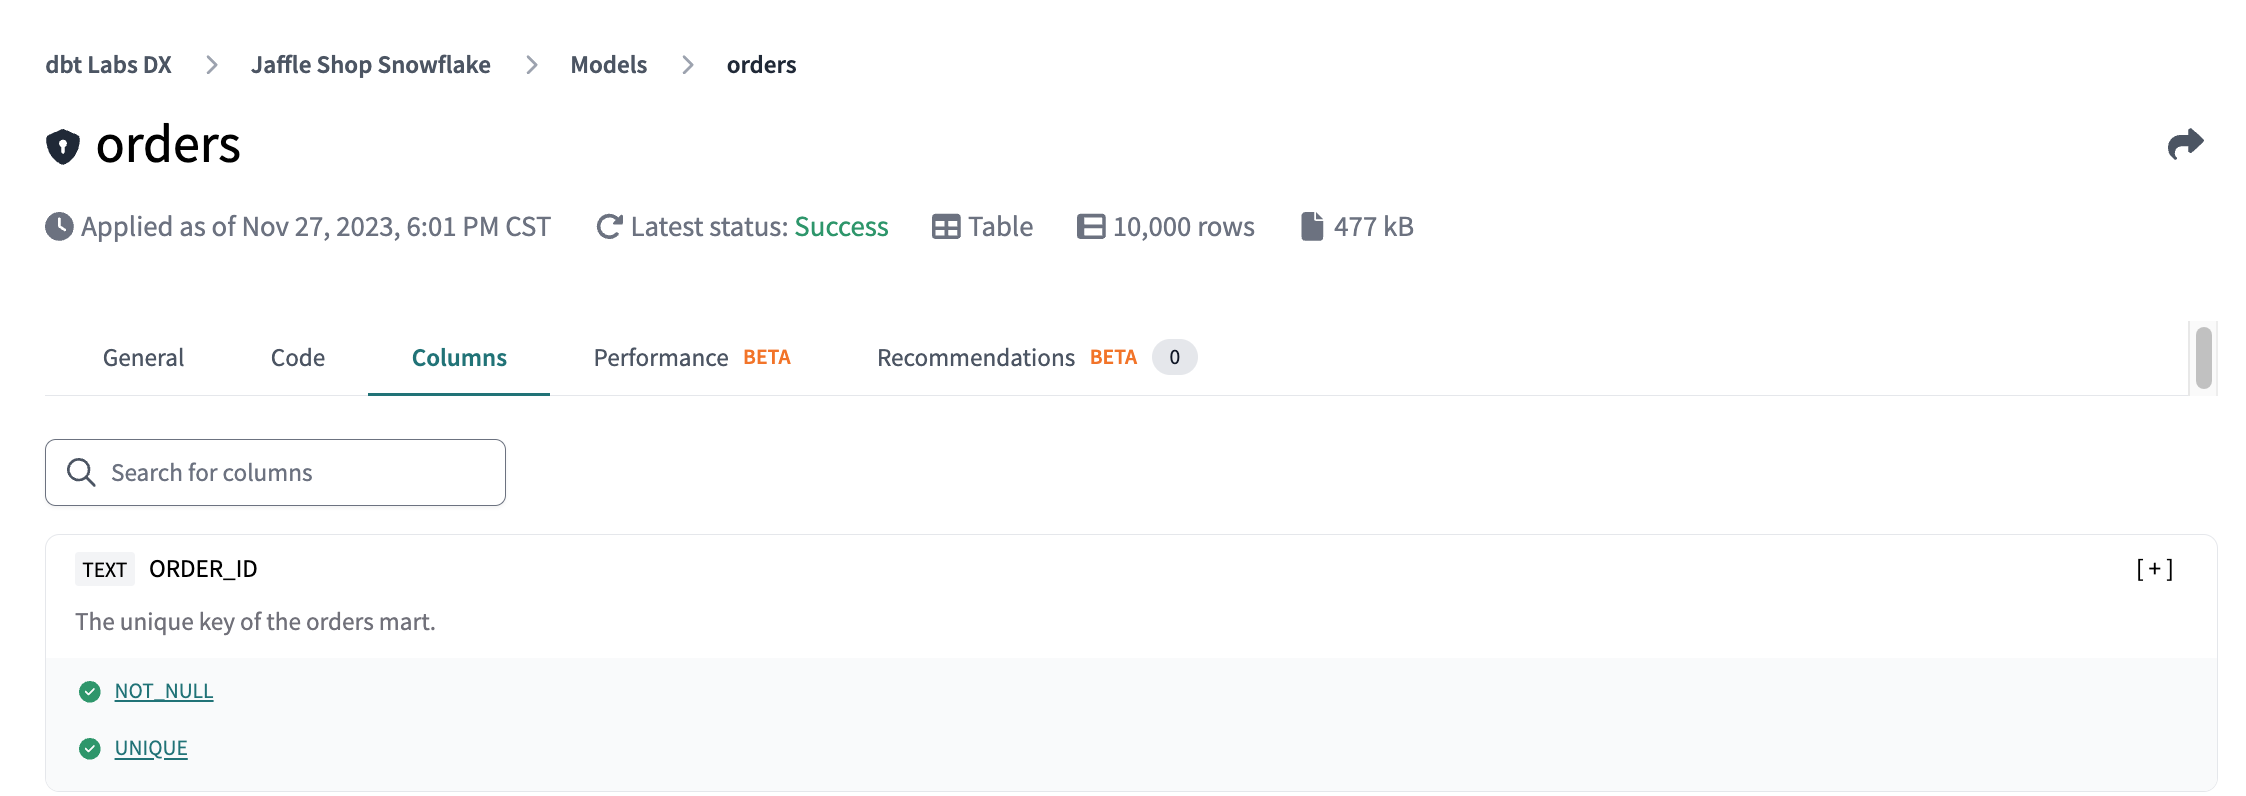
dbt Explorer marries the execution metadata to the documentation experience — it reflects the latest state of your project across all your job runs in your production environment, and embeds the execution information throughout the product. For each model, seed, or snapshot, Explorer displays its latest execution status, as well as statuses for any tests run against those resources. Sources show the latest source freshness info, and exposures embed the aggregate test and freshness info right into the details page! No more leaving the docs site to check the most recent logs to see what’s fresh and what’s not — Explorer centralizes everything so you don’t have to!
Is the project healthy? Are we managing it properly?
Beyond building solid data products and making sure they are trusted and used, developers need to know how they may improve their projects’ quality, or what areas may need some focus for refactoring and optimization in the next quarter. There’s always a balance between maintaining a data platform and adding new features to it. Historically, it’s been hard to know exactly where to invest time and effort to improve the health of your project — dbt Explorer provides two features that shine a light on possible areas for improvement within your project.
Recommendations
One of dbt’s more popular open source packages is dbt_project_evaluator , which tests your project against a set of well established dbt best practices. dbt Explorer now surfaces many of the same recommendations directly within the explorer UI using the metadata from the Discovery API, without any need to download and run the package!
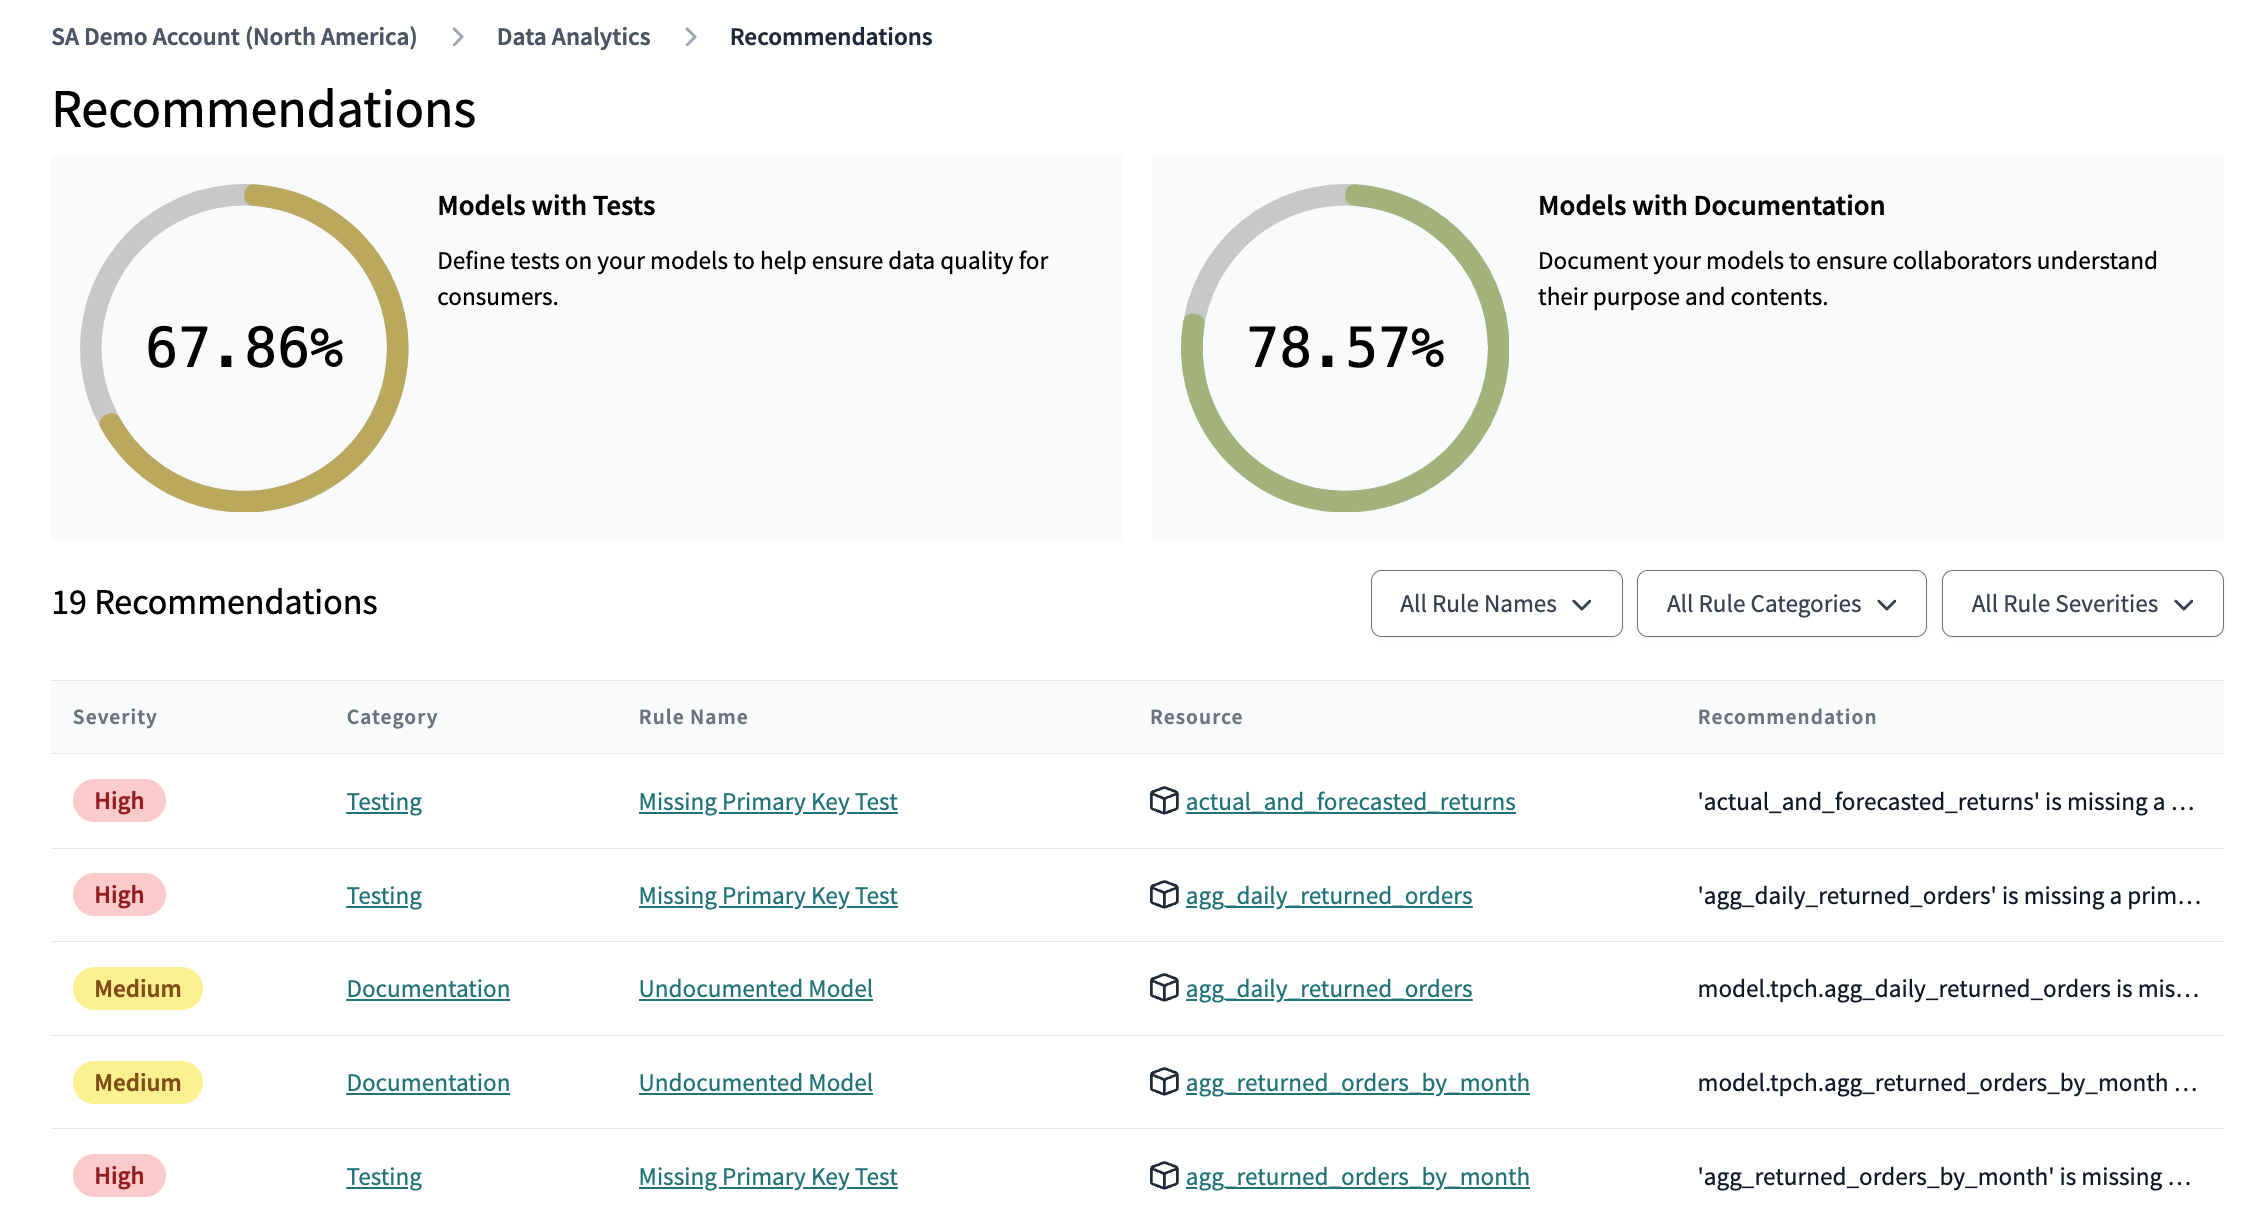
Each model and source has a Recommendations tab on their resource details page, with specific recommendations on how to improve the quality of that resource. Explorer also offers a global view, showing all the recommendations across the project, and includes some top level metrics measuring the test and documentation coverage of the models in your project. These recommendations provide insight into how you can build a more well documented, well tested, and well built project, leading to less confusion and more trust.
Model Performance Trends
A huge pain point for analytics engineers is trying to understand if their dbt models are taking longer or are running less efficiently over time. A model that worked great when your data was small may not work so great when your platform matures! Unless things start to actively break, it can be hard to know where to focus your refactoring work.
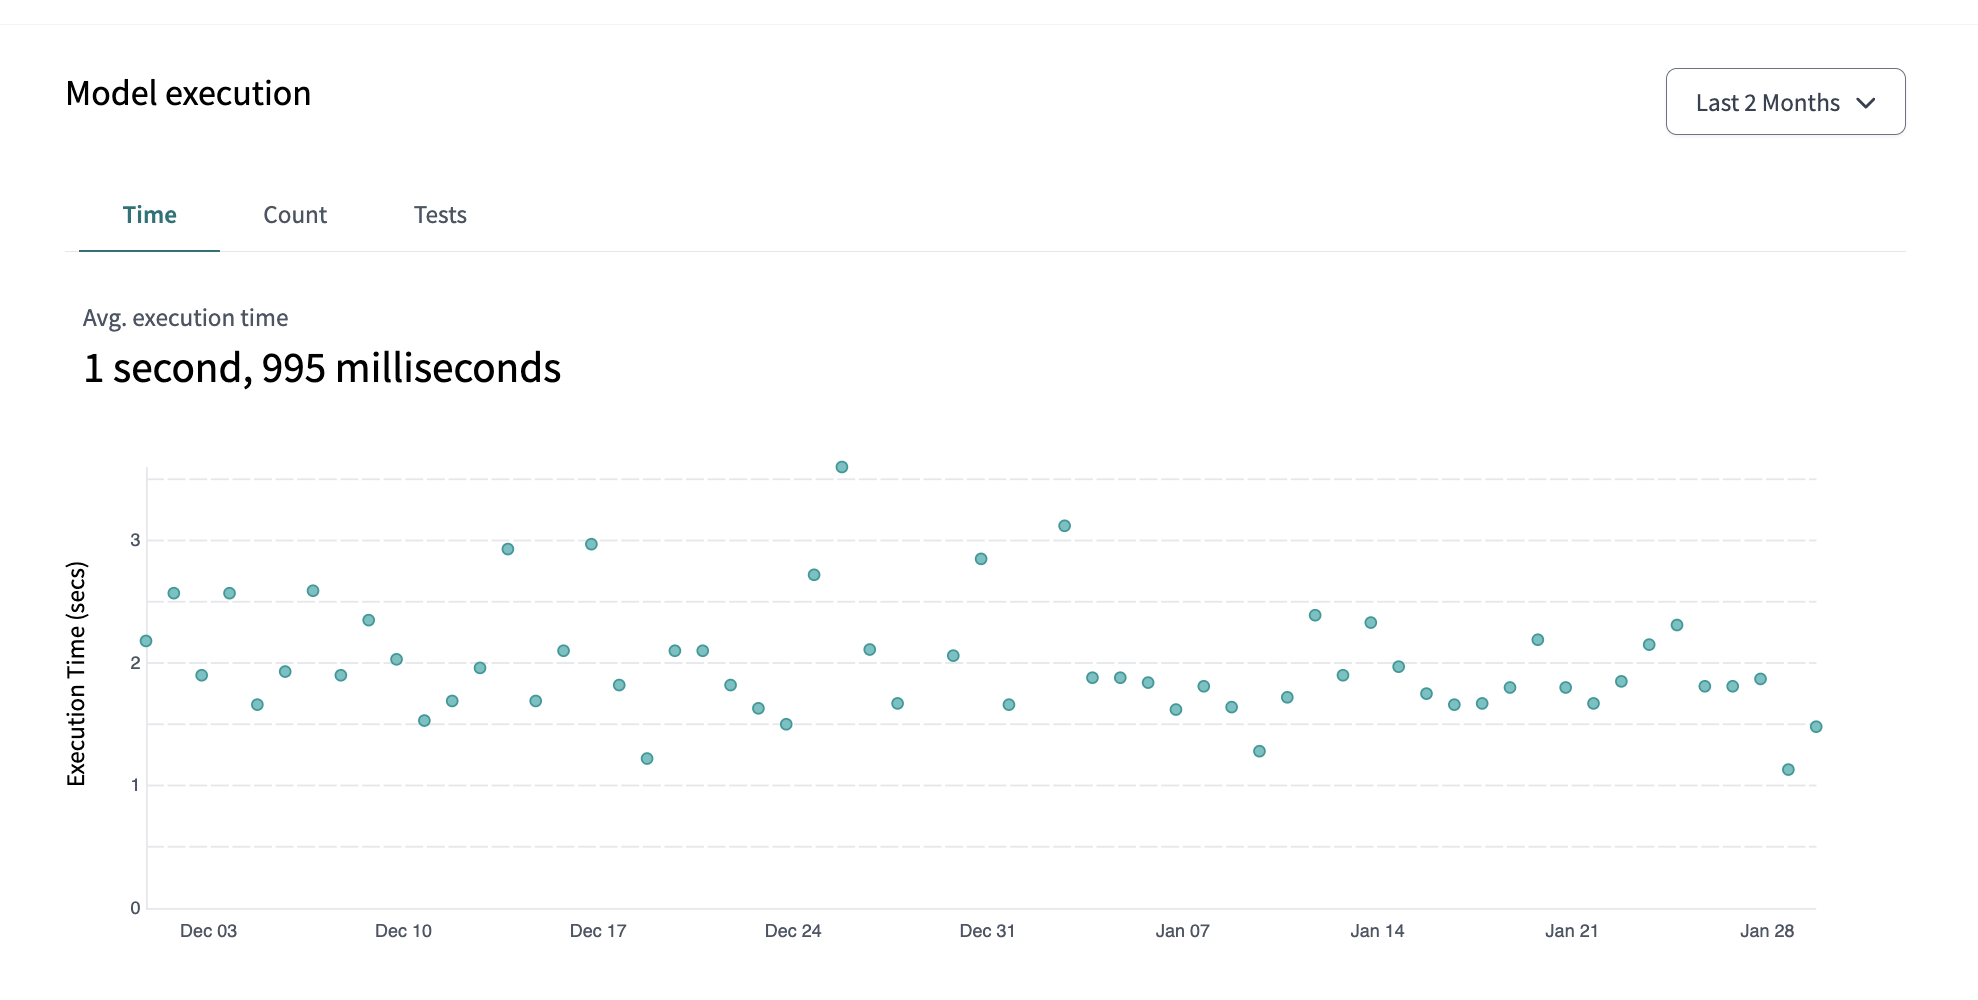
dbt Explorer now surfaces model execution metadata to take the guesswork out of fine tuning your dbt runs. There’s a new high level overview page to highlight models that are taking the longest to run, erroring the most, and that have the highest rate of test failures. Each model details page also has a new Performance tab, which shows that particular model’s execution history for up to three months of job runs. Spotting an ominous slow increase in runtimes may indicate it’s time for some refactoring — no need to comb through countless run_results.json files yourself! dbt Explorer gets you the data you need where you need it.
Bon voyage!
They say the best time to invest plant a tree document your dbt project is yesterday, and the second best time is today. With all the bells and whistles that supercharge your documentation experience in dbt Explorer, there’s no time like the present! Leaning into your documentation and taking advantage of your metadata in dbt Explorer will lead to better data products shipped faster — get out there and explore!


Comments